To trade a descending triangle first of all you must spot one that is clear formatted. The clear formation of the upper line is more important than the clear formation of the lower line. In case that the upper line, which is basically the trendline in a downtrend, is not clearly defined then it is better to avoid the trade.
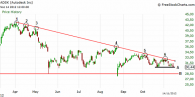
On November 2 we spotted a descending triangle in ADSK stock (below).

Notice that in order to define the triangle we had to combine spots 1, 2, 3, 4, 5 and then enter short on 6. This is the optimal entry point in a descending triangle. The sooner you get this signal the higher the profit becomes if the price declines.
We opened a short position on Friday November 2 at $32.52 and we placed an initial stop loss order above the trendline (specifically at $33.02). The first profit target was at line A because at this price we can see a minor support and the second target was at line B, although we know that the price target in a descending triangle is below the lower support (line B). The company would have to announce quarterly results on November 15 so we hadn’t much time to hold the position open. We never hold open positions in stocks that are about to make a very important announcement.
We exit the trade on the first target due to activation of the stop loss order after placing it much below the initial stop ($33.02), in order to protect profits. The net profit/share was $1.52 and the total duration of the trade was 7 days including a weekend (closed position on Friday November 9).
Notice also that the market is already in a downtrend (see SPY chart below) and that’s why we opened a short position in the first place. Swing trades that are in accordance with the short term market trend have much more chances of success. The circled red candlestick had formed in SPY the same day we opened the short position in the stock.

 En
En Gr
Gr