I don’t believe very much in technical indicators that are completely mathematical and ignore the peculiarities of a specific price chart. The Fibonacci retracement is such an indicator, but I have to admit that it works in many cases. I guess it’s a self-fulfilled prophecy and not a common situation in nature, that the advocates […]
Read MorePosts tagged "support"
Swing trade based on descending triangle
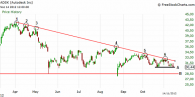
To trade a descending triangle first of all you must spot one that is clear formatted. The clear formation of the upper line is more important than the clear formation of the lower line. In case that the upper line, which is basically the trendline in a downtrend, is not clearly defined then it is […]
Read MoreAn ”almost” very successful swing trade
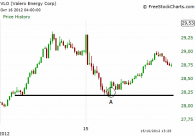
Entry time: 10.35 EDT on Monday October 15. Exit time: 11.56 EDT on Friday October 19. Trade duration: 4 days. Entry price: $28.26. Exit price: $29.29. Strategy: Reversal long. Net profit: 1 dollar/share. Sometimes, someone can find a very promising pattern but various market conditions can spoil the trade. Although this was a winning trade […]
Read MoreDay trade on October 3
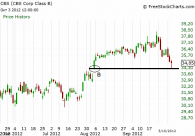
Entry time: 10.59 EDT. Exit time: 11.24 EDT. Trade duration: 24 minutes Entry price: $34.16. Exit price: $34.56. Strategy: Reversal long. Net profit: 36.50 cents/share. Criteria for taking the trade: 1. The market is in uptrend in the short term (SPY daily chart below). 2. The intraday 5 minutes chart of SPY is also in an uptrend (below). […]
Read MoreDay trade on July 30
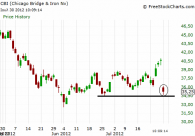
Entry time: 09.46 EDT. Exit time: 09.48 EDT. Entry price: $34.97. Exit price: $35.28. Strategy: Reversal long. Net profit: 27.50 cents/share. Criteria for taking the trade: 1. The market is in uptrend in the short term (SPY daily chart below). 2. CBI has visited a strong support (daily chart below) and it was hovering about 15 cents above its […]
Read More En
En Gr
Gr