The green and the red elongated and consecutive candlesticks (circled in the SPY chart below) are an indication of ambivalence between bullish and bearish sentiment. This ambivalence when the chart is on new highs augments the possibilities of short term correction. Notice that the length of the candlesticks is of great importance here.
I wouldn’t suggest any long entries before a correction occurs. Generally good entry points are:
1. Near the trendline after confirmation from a candlestick pattern
2. After the price visits a strong support (about $166 in the SPY chart) and again only after confirmation from candlestick pattern.
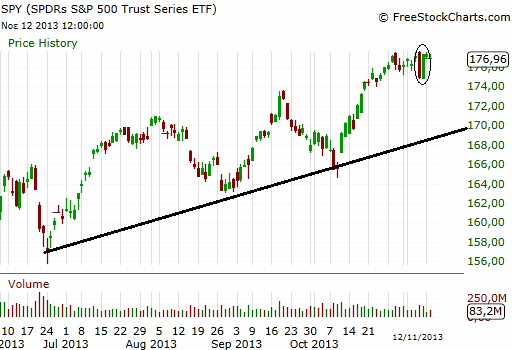
SPY chart
 En
En Gr
Gr