Entry time: 10.59 EDT.
Exit time: 11.24 EDT.
Trade duration: 24 minutes
Entry price: $34.16.
Exit price: $34.56.
Strategy: Reversal long.
Net profit: 36.50 cents/share.
Criteria for taking the trade:
1. The market is in uptrend in the short term (SPY daily chart below).

2. The intraday 5 minutes chart of SPY is also in an uptrend (below). The circled candlestick denotes the point that the market (SPY) was, when we entered the trade in the stock.

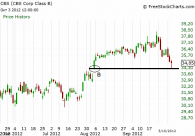
3. CBS has visited a strong support (daily chart below), which is defined from the upper candlestick of the gap up at point B. The stock price is almost exactly at the lower point of the support. The possibility of a bullish reversal here was quite high because the market is in an intraday and a short-term uptrend and the stock was visiting for the first time a strong support. The supports formed after gaps up are by themselves very strong due to trapped short sellers that have no time to close their position (see page ”support/resistance property” for a complete explanation of the mechanism).

4. The main chart used in order to open the long position was the 5 minutes time frame (below), without waiting for confirmation. The entry was at the red circled candlestick. We placed the initial stop loss some cents below the lower of the red candlestick (at $34.09). The profit target was at the nearest resistance at $34.60. The loss/profit ratio was 7:44 or 1:6, quite above the minimum of 1:3.

Notice also that in the 1 minute chart of CBS a breakout pattern is formed after about 15 minutes (below). Even if we didn’t know before the opening of the position that it will be formed, a breakout pattern within a long reversal is one of the best indications that the reversal will continue developing.

The exit was at $34.56 due to the stop being hit after moving it successively upwards.
 En
En Gr
Gr