Entry time: 10.35 EDT on Monday October 15.
Exit time: 11.56 EDT on Friday October 19.
Trade duration: 4 days.
Entry price: $28.26.
Exit price: $29.29.
Strategy: Reversal long.
Net profit: 1 dollar/share.
Sometimes, someone can find a very promising pattern but various market conditions can spoil the trade. Although this was a winning trade the position closed many dollars before the profit target and hence the phrase ”almost” very successful. Although the stock had an upward tendency the broad downward moving market didn’t let it to develop and the stop loss closed the position at $29.29.
The certain trade was initially taken as a day trade but at the end of the session, if all the prerequisites of a swing trade are fulfilled, then it is ”legitimate” to keep our position open in order to pursuit higher profits. When someone is opening a position for day trading and finds himself holding the position for swing trading, he/she always is at the pleasant situation where the risk is very small and the profit, relatively to the risk, is very high. In day trading a stop loss is most of the times much smaller than in swing (and the profit target also) and in swing trading the profit target is much bigger than in day trading (and the stop loss also).
In that sense this is the best trading combination someone can achieve. A very small stop for a very high profit. Additionally the loss/profit ratio in such cases can reach extreme levels such as 1:20 or even 1:40, which is very beneficial for us.
Criteria for opening the position:
1. By looking at the 5 minutes market (SPY) chart we can see that price is visiting for the first time a support created in the previous day (below). Here we have some potential for a reversal, although without doubt the support is not the strongest possible. Our goal is the scalping of some cents by placing an even smaller stop loss. So we must find the appropriate stock to apply the reversal strategy.

2. By looking at the 5 minutes chart of VLO we can see that price has visited a support for the first time (below), after a sharp decline of $1. So, we have a simultaneous first time visiting of a support at SPY and at VLO 5 minutes charts. We know with a relatively high degree of certainty, that due to the effect of market on stock prices, if SPY reverses, then VLO will also reverse and that’s why we want the two charts to move in tandem. We opened a long position on the green circled candlestick by using this small time frame.

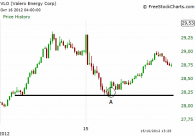
We kept the position opened until the end of the day as the price continued rising. For a better depiction of where we entered and where the price was on the end of the session, we can see the daily chart of VLO below. Line 1 shows the entry point and line 2 shows where the stock closed that day.

3. SPY in the end of the same day has formed a reversal candlestick pattern a little below a broken trendline which looks like a morning star (circled chart area below), so from a technical point of view we had every reason to hold the position for a swing trade (reading of news that might affect the stock is also necessary).

4. The next day as the market kept on advancing, the stock formed a clear three inside up candlestick pattern which further confirmed our decision to stay long (circled chart area below).

On the fourth day the stop loss got hit because of a sharp decline in the broad market, due to bad quarterly results of some blue chips (below). Although the maximum paper profit at sometime was almost $1.90/share we manage to secure $1/share.

Notice below in the daily chart of VLO that the stock despite the sharp decline of the market remained almost unchanged, which tells us that it had a good upward ”mood”, although it didn’t develop it due to the market effect on its price.

 En
En Gr
Gr