
Positron Investments

Trading & Education in Options, Futures, Stocks, Forex
  • Home
  • Technical analysis
    • Technical analysis basics
    • Candlesticks patterns
  • Options
    • Options basics
    • Options strategies
    • Binary options OTC
  • Futures
    • Futures basics
  • Forex
    • Forex basics
  • MarketViewer
  • Contact
  • el
  • S&P5001771.95+9.84 - +0.56%
  • NASDAQ3952.338+12.209 - +0.31%
  • LONDON6774.73+48.91 - +0.73%
  • DAX9022.04+43.39 - +0.48%
  • NIKKEI14491.19+165.21 - +1.15%
  • EUR/USD1.3742


Calendar

⇐ ⇒October 2013
M T W T F S S
30 1 2 3 4 5 6
7 8 9 10 11 12 13
14 15 16 17 18 19 20
21 22 23 24 25 26 27
28 29 30 31 1 2 3

Categories

  • Day/swing trades
  • Economy/Politics
  • Trading signals
  • Trading strategies

Archives

  • October 2013
  • May 2013
  • March 2013
  • February 2013
  • January 2013
  • December 2012
  • November 2012
  • October 2012
  • September 2012
  • July 2012

Possible long in ORCL

Long ORCL

One of the best strategies that I use is looking for stocks that in the context of an upward market they are visiting a trendline or horizontal support after a downward correction.

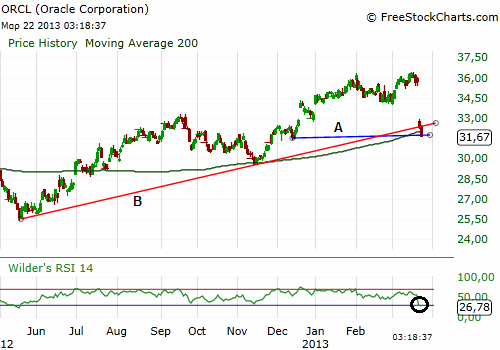
A possible candidate for the initiation of a long position is Oracle (ORCL). As it is obvious from the daily chart below a gap down has recently occurred, due to quarterly results below expectations.

There are 6 basic criteria in which I will base a possible long position in ORCL in the next days (only if the right time comes, I am not hesitant to change my mind if market conditions change). These criteria are:

  1. The stock has visited for the first time a horizontal support after a gap down (red line A).
  2. This point almost coincides with the trendline support (blue line B).
  3. The RSI(14) is indicating that the stock is oversold (circled area).
  4. The broad stock market (SPY) is still in an uptrend and will, as long as the uptrend continues, boost the price of ORCL.
  5. The price is very close to the 200 days moving average which many institutional traders/investors use it as a possible support area (green line).
  6. The downside risk is relatively low due to the steep decline (gap down) of the stock. So, if the market starts a downward move the stock might hold its price level in a better fashion than other stocks that have reached and are now at new highs.
Long ORCL

Long ORCL

Of course a stop loss will be in place in case of bad decision.

I will initiate the long position only if I observe indications that the buyers are taking control again. This might be shown with a bullish candlestick pattern or even when the RSI will break the 30 signal line upwards. 

gap down, long, orcl, oversold, rsi

Leave a Reply Cancel reply

Your email address will not be published.

You may use these HTML tags and attributes: <a href="" title=""> <abbr title=""> <acronym title=""> <b> <blockquote cite=""> <cite> <code> <del datetime=""> <em> <i> <q cite=""> <strike> <strong>

Links

Recent posts

  • Possible upward movement in S&P 500
  • Long signal in Greek bank stocks
  • Possible long in ORCL
  • Hedging in assets denominated in foreign currency
  • Short selling signal in EUR/JPY on 12-Feb

Blog categories

  • Day/swing trades
  • Economy/Politics
  • Trading signals
  • Trading strategies

About Positron

Curriculum vitae
Sitemap

Share

Follow us

Copyright © 2013 Positron-investments.com - All rights reserved.

  • En En
  • Gr Gr