In this example we can see the application of our core strategy (described here). It is a combination of a trendline and a candlestick pattern which is used as a confirmation before we open a long position. The candlestick pattern that confirms the reversal of the trend in EUR/USD chart below is named three stars in the south and is characterized by three candlesticks where the first engulfs the second and the second engulfs the third (in the circle).
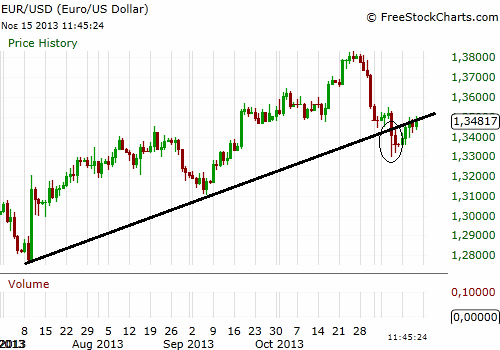
Three stars in the south
Below we can see the same chart magnified.
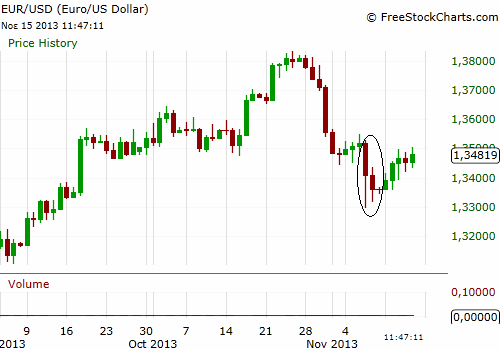
Three stars in the south
Also below we can see the ”by the book” definition of the three stars in the south pattern. For a more analytic catalog of reversal candlestick patterns please press here.

The core strategy describes how we can find where a reversal on a price chart will occur by using a trendline and a candlestick pattern which is formed near the trendline. In the present example we have a clear sign of an imminent reversal in the short term downtrend and a possible beginning of a new short term uptrend.
 En
En Gr
Gr