As we described in a previous article a short term downtrend has been formed in the Greek stock exchange. In the last four days the general index is consolidating near 1150 points and it is creating the right environment for a breakdown (see chart below). In combination with the line of the downtrend, we have […]
Read MoreTrading signals
S&P 500 runs out of fuel
The green and the red elongated and consecutive candlesticks (circled in the SPY chart below) are an indication of ambivalence between bullish and bearish sentiment. This ambivalence when the chart is on new highs augments the possibilities of short term correction. Notice that the length of the candlesticks is of great importance here. I wouldn’t […]
Read MoreShort term downtrend in Greek stock exchange
As we can clearly see in the chart below the index of the Greek stock exchange has already formed three consecutive lower highs and lower lows (we need at least two in order to define a downtrend). This is a high probability indication that the index will be in a short term downtrend. Under these […]
Read MorePossible upward movement in S&P 500
Despite the shutdown of the US government and the anxiety it brings to investors/traders we have indications of an upward movement for the major US stock indices. The three last candlesticks of the daily chart of S&P 500 (below) are forming a morning star bullish reversal pattern. This is happening on an up slopping trendline […]
Read MoreLong signal in Greek bank stocks
At least relatively to bank stocks in the Greek stock exchange the prior downtrend that has been developing from November 2012, shows clear signs of reversal. As we can see in the charts of the three basic Greek bank stocks we have at least two higher consecutive lows (A,C) and two higher consecutive highs (B,D). These […]
Read MorePossible long in ORCL
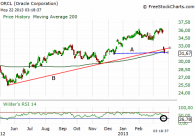
One of the best strategies that I use is looking for stocks that in the context of an upward market they are visiting a trendline or horizontal support after a downward correction. A possible candidate for the initiation of a long position is Oracle (ORCL). As it is obvious from the daily chart below a […]
Read MoreShort selling signal in EUR/JPY on 12-Feb
Notice the negative divergence of the RSI(14) on the daily EUR/JPY. Possible new downtrend from that point. Entry today 12-Feb-2013 with stop above the last red candlestick.
Read MoreNegative divergence at SPY RSI on Feb 11
One of the most reliable signals that an oscillator can provide is negative or positive divergences. By using this method the probability to spot a reversal in the existing trend is magnified, especially when the divergence occurs near or at a support or resistance. A negative divergence is when the price chart forms two consecutive […]
Read MoreTrading signal on Greek stock exchange

We can see a clear downtrend in banking stocks in the Greek stock exchange (daily chart). In that case the only possible action is short selling when the stock price visits the downtrend line. We have spotted 3 banking stocks as candidates for short selling even though we expect all banking stocks to move in tandem […]
Read More En
En Gr
Gr