
One of the best strategies that I use is looking for stocks that in the context of an upward market they are visiting a trendline or horizontal support after a downward correction.
A possible candidate for the initiation of a long position is Oracle (ORCL). As it is obvious from the daily chart below a gap down has recently occurred, due to quarterly results below expectations.
There are 6 basic criteria in which I will base a possible long position in ORCL in the next days (only if the right time comes, I am not hesitant to change my mind if market conditions change). These criteria are:
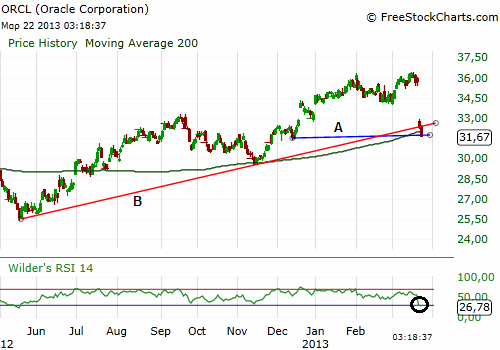
- The stock has visited for the first time a horizontal support after a gap down (red line A).
- This point almost coincides with the trendline support (blue line B).
- The RSI(14) is indicating that the stock is oversold (circled area).
- The broad stock market (SPY) is still in an uptrend and will, as long as the uptrend continues, boost the price of ORCL.
- The price is very close to the 200 days moving average which many institutional traders/investors use it as a possible support area (green line).
- The downside risk is relatively low due to the steep decline (gap down) of the stock. So, if the market starts a downward move the stock might hold its price level in a better fashion than other stocks that have reached and are now at new highs.
Long ORCL
Of course a stop loss will be in place in case of bad decision.
I will initiate the long position only if I observe indications that the buyers are taking control again. This might be shown with a bullish candlestick pattern or even when the RSI will break the 30 signal line upwards.
 En
En Gr
Gr