The protective put strategy is not exactly a bullish strategy but it is mostly a hedging strategy.
Construction
The protective put strategy is like a synthetic long call because it has the same profit/loss diagram and risk profile (see page ”put-call parity” for a better understanding of the mechanism).
When to use
We use the protective put strategy when we are already long in the stock and we want to protect ourselves from a potential downward move. Preferably implied volatility should be low when we are buying the put, although the main goal of the strategy is protection so we can ignore volatility for our purpose. The long put position should partially counterbalance the loss on the long stock position due to a decline in price. The degree of protection before expiration is relative to the Delta and Gamma of the put.
Loss/Profit at expiration
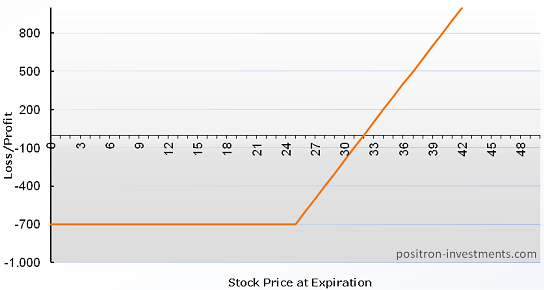
Maximum loss: (Price we bought the stock – strike price) + premium we paid for the put + commissions.
Maximum profit: Unlimited to the upside due to the stock position – premium we paid for the put – commissions.
Profit/Loss diagram
Below we present the profit loss diagram for the strategy protective put. Suppose that we have bought 100 shares at $28, the strike price of the put is $25 and its premium is $4/share. Notice that the maximum loss is equal to the total premium we paid ($400) plus the difference between the strike price and the purchase price of the stock ($300), overall $700.
Protective put strategy example
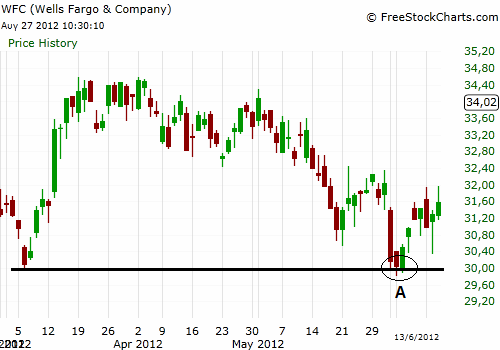
In WFC daily chart (below) we have open a long stock position when price visited a support level for the first time (point A). Although we believe in the upward potential of the stock we fear that due to short term market turbulence our expectation might be wrong. In that case we can buy puts with strike price $30 to protect our stock position from an imminent decline below this level. If the stock price reduces below $30 then what we are losing from our position in the stock will be gained from our long position in the puts (depending also on the Delta and Gamma).


 En
En Gr
Gr