One of the most reliable signals that an oscillator can provide is negative or positive divergences. By using this method the probability to spot a reversal in the existing trend is magnified, especially when the divergence occurs near or at a support or resistance.
A negative divergence is when the price chart forms two consecutive higher highs but at the same points the oscillator forms two consecutive lower highs. This is a sign that the uptrend is weakening and it might reverse (short or long term).
Below we can see the daily chart of ETF SPY which is a proxy for the US stock market. We can clearly see that a negative divergence in RSI(14) has been formed and this is signaling a possible downward correction.
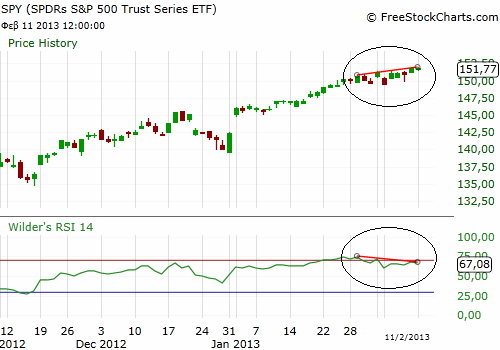
Negative divergence in RSI(14)
This negative divergence occurs within a resistance zone as we can see in the weekly chart of SPY below.
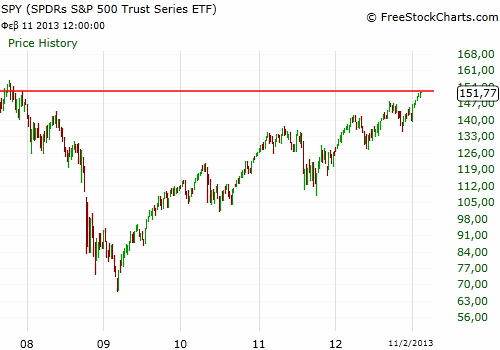
Resistance in SPY weekly chart
Of course in case that someone opens a short position a stop loss order must be used because no signal is 100% accurate and in case of a price move against us we want to exit the trade with a small loss.
 En
En Gr
Gr