Notice the negative divergence of the RSI(14) on the daily EUR/JPY. Possible new downtrend from that point. Entry today 12-Feb-2013 with stop above the last red candlestick.
Read MoreNegative divergence at SPY RSI on Feb 11
One of the most reliable signals that an oscillator can provide is negative or positive divergences. By using this method the probability to spot a reversal in the existing trend is magnified, especially when the divergence occurs near or at a support or resistance. A negative divergence is when the price chart forms two consecutive […]
Read MoreHow to deal with false signals near trendlines
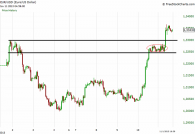
One of the simplest and yet best strategies, is to get long when price is visiting a trendline in an uptrend after a downward correction or to get short when price is visiting the trendline in a downtrend after an upward correction (see the two daily charts of EUR/USD that are following. Also for better […]
Read MoreThe importance of time stops in reversals
A time stop is when we purposely exit a position after a period of time because the price is not moving in our favor. Time stops are mostly necessary in reversals, meaning when we want to go long when price visits a support or short when price visits a resistance. When price is near or […]
Read MoreTrading signal on Greek stock exchange

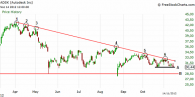
We can see a clear downtrend in banking stocks in the Greek stock exchange (daily chart). In that case the only possible action is short selling when the stock price visits the downtrend line. We have spotted 3 banking stocks as candidates for short selling even though we expect all banking stocks to move in tandem […]
Read MoreFibonacci retracement signals on S&P 500
I don’t believe very much in technical indicators that are completely mathematical and ignore the peculiarities of a specific price chart. The Fibonacci retracement is such an indicator, but I have to admit that it works in many cases. I guess it’s a self-fulfilled prophecy and not a common situation in nature, that the advocates […]
Read MoreThe diamond chart pattern
The diamond chart pattern can signal a bullish or a bearish reversal or continuation of an existing trend. It represents a temporary battle between buyers and sellers. At its last part (lines E and H below) it is formatted from consecutive lower highs (indication that sellers have the upper hand) and simultaneously consecutive higher lows […]
Read MoreSwing trade based on descending triangle
To trade a descending triangle first of all you must spot one that is clear formatted. The clear formation of the upper line is more important than the clear formation of the lower line. In case that the upper line, which is basically the trendline in a downtrend, is not clearly defined then it is […]
Read MoreHow to spot the beginning of a new trend
An uptrend can be defined as two consecutive higher lows and higher highs. So, if we have spotted an already existing uptrend then we expect that after the higher low there will be a higher high. Failure to accomplish the expected higher high is an indication that the existing uptrend is weakening and a new […]
Read MoreΗ πλατφόρμα συναλλαγών Plus500
Η επιλογή πλατφόρμας συναλλαγών δεν είναι εύκολη υπόθεση και σίγουρα μπορεί να σας απασχολήσει γι αρκετά μεγάλο χρονικό διάστημα. Από την άλλη πλευρά το να ψάχνετε για την τέλεια πλατφόρμα η οποία θα έχει και χαμηλές προμήθειες και άψογα γραφήματα και ευκολία χρήσης ή ότι άλλο επιθυμείτε, είναι μια μάλλον μάταιη αναζήτηση. Κάθε πλατφόρμα συναλλαγών […]
Read More En
En Gr
Gr