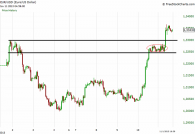
In this example we can see the application of our core strategy (described here). It is a combination of a trendline and a candlestick pattern which is used as a confirmation before we open a long position. The candlestick pattern that confirms the reversal of the trend in EUR/USD chart below is named three stars in the […]
Read MoreTrading strategies
Hedging in assets denominated in foreign currency
This article describes in a simple and straightforward way how someone can be protected against currency fluctuations in case he/she has opened a position in a foreign asset (asset denominated in another currency). Suppose that you are a US citizen and you have bought 500 shares of Toyota motor in the Japanese stock exchange. Each […]
Read MoreHow to deal with false signals near trendlines
One of the simplest and yet best strategies, is to get long when price is visiting a trendline in an uptrend after a downward correction or to get short when price is visiting the trendline in a downtrend after an upward correction (see the two daily charts of EUR/USD that are following. Also for better […]
Read MoreThe importance of time stops in reversals
A time stop is when we purposely exit a position after a period of time because the price is not moving in our favor. Time stops are mostly necessary in reversals, meaning when we want to go long when price visits a support or short when price visits a resistance. When price is near or […]
Read MoreFibonacci retracement signals on S&P 500
I don’t believe very much in technical indicators that are completely mathematical and ignore the peculiarities of a specific price chart. The Fibonacci retracement is such an indicator, but I have to admit that it works in many cases. I guess it’s a self-fulfilled prophecy and not a common situation in nature, that the advocates […]
Read MoreThe diamond chart pattern
The diamond chart pattern can signal a bullish or a bearish reversal or continuation of an existing trend. It represents a temporary battle between buyers and sellers. At its last part (lines E and H below) it is formatted from consecutive lower highs (indication that sellers have the upper hand) and simultaneously consecutive higher lows […]
Read MoreHow to spot the beginning of a new trend
An uptrend can be defined as two consecutive higher lows and higher highs. So, if we have spotted an already existing uptrend then we expect that after the higher low there will be a higher high. Failure to accomplish the expected higher high is an indication that the existing uptrend is weakening and a new […]
Read MoreA very simple trading strategy
A simple trading strategy doesn’t mean an unreliable strategy, on the contrary. Success in trading lies on a set of simple rules that have to be followed strictly. By rules we basically mean technical analysis and risk management rules. A very simple trend following strategy which works in all time frames (day & swing trading) […]
Read More En
En Gr
Gr